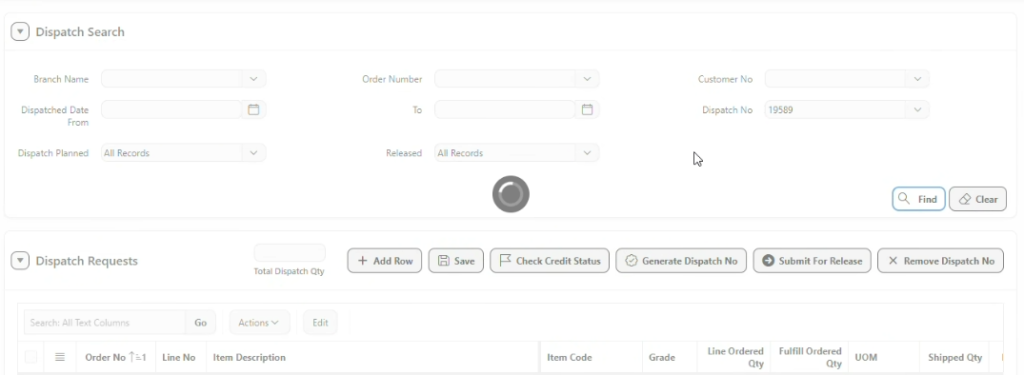
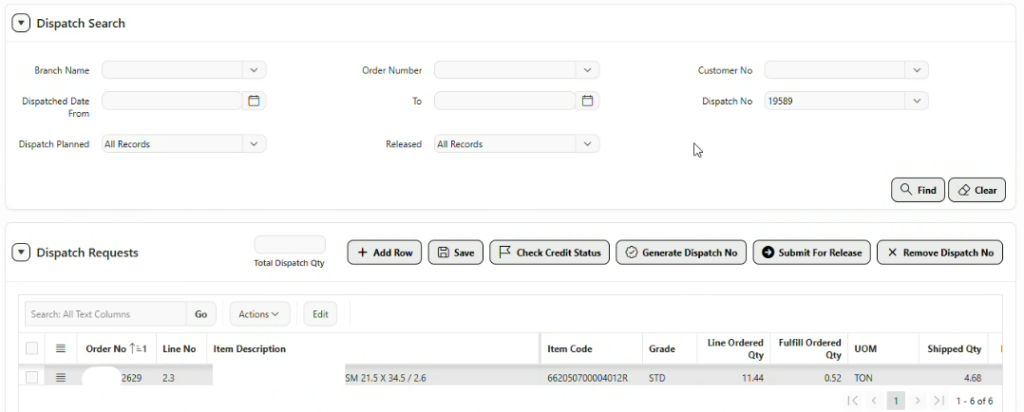
Issue Faced
Enabling APEX Session Debugging through GUI
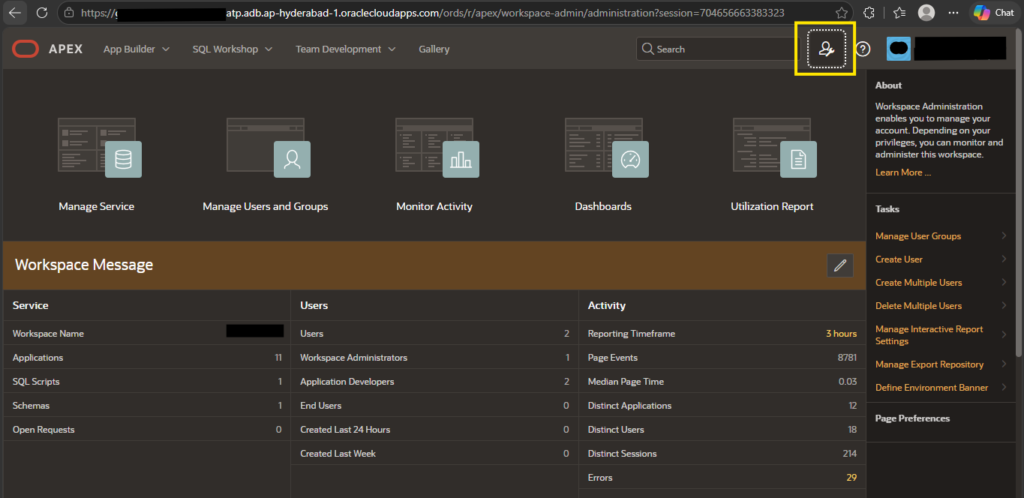
Login in as Workspace Administrator user in APEX.
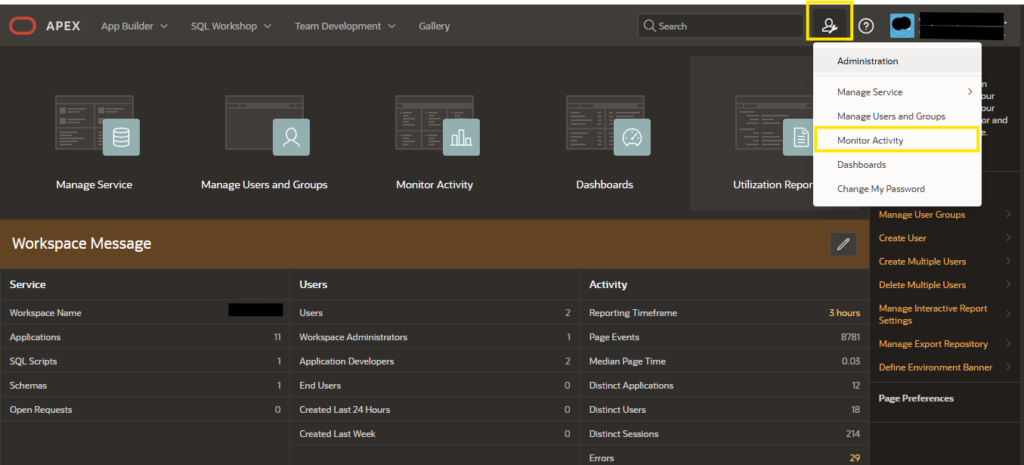
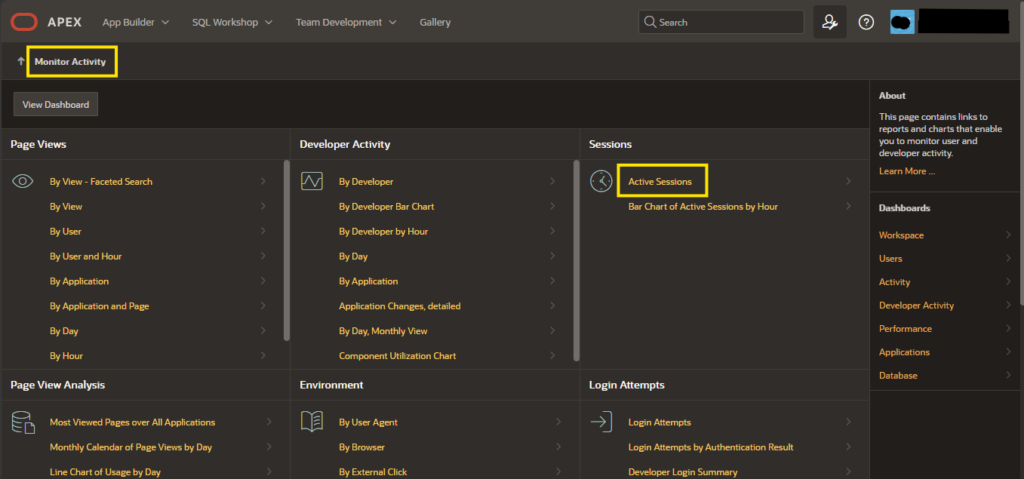
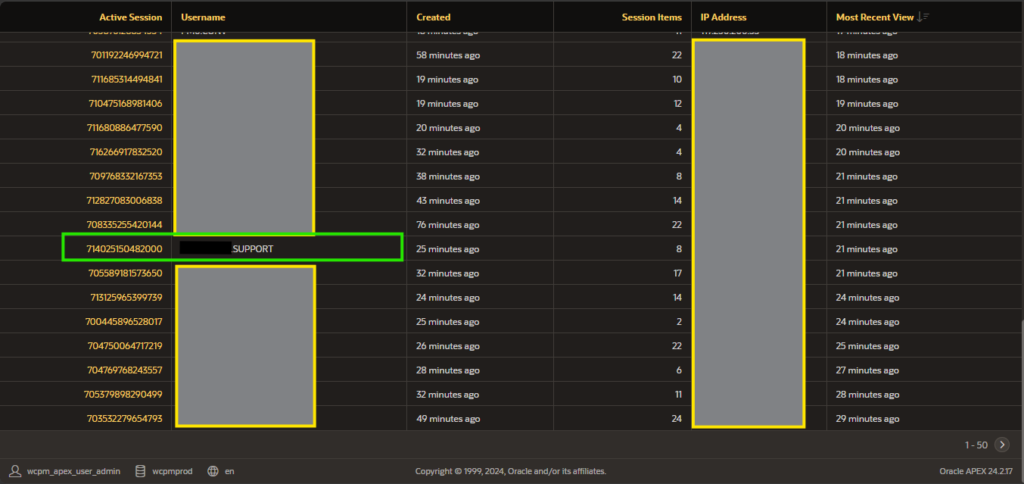
Navigate: Administration -> Monitor Activity -> Active Sessions
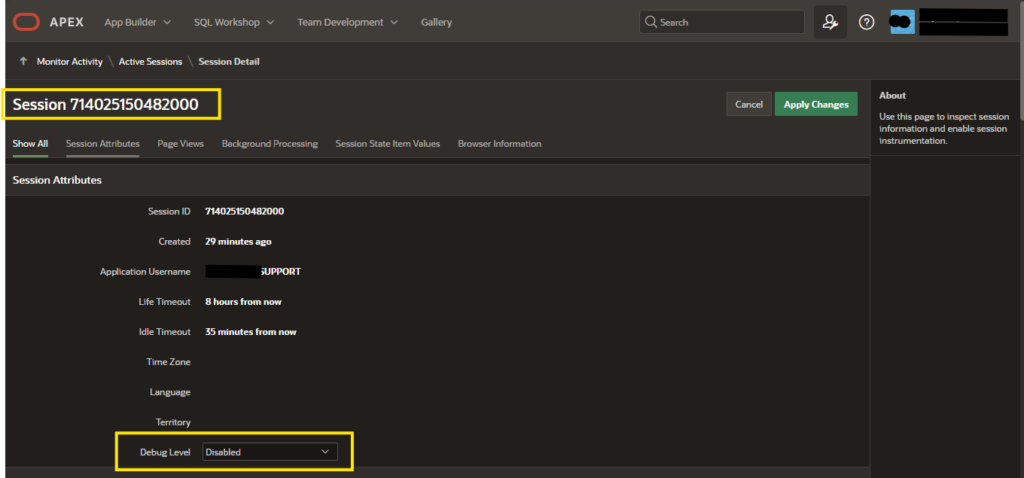
Click on the session with the user logged in.
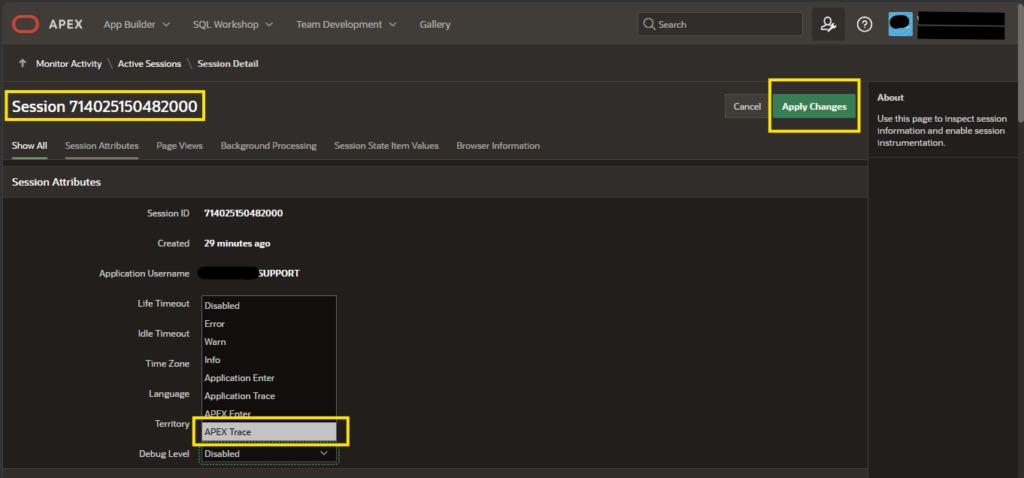
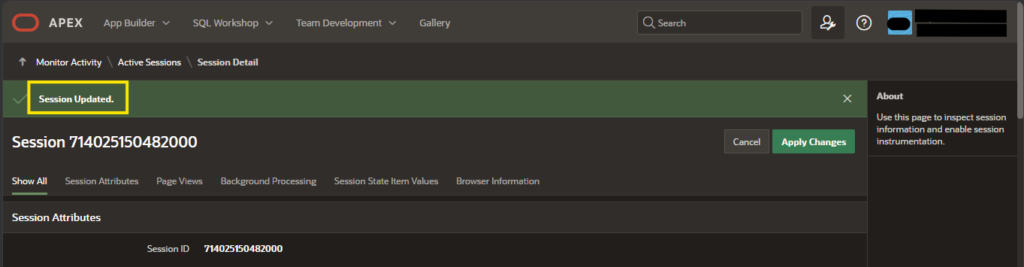
Set Debug Level to APEX Trace.
Click Apply Changes.
Request user to re-produce the error.
Once done, set Debug Level back to Disabled for the specific session.
Click Apply Changes.
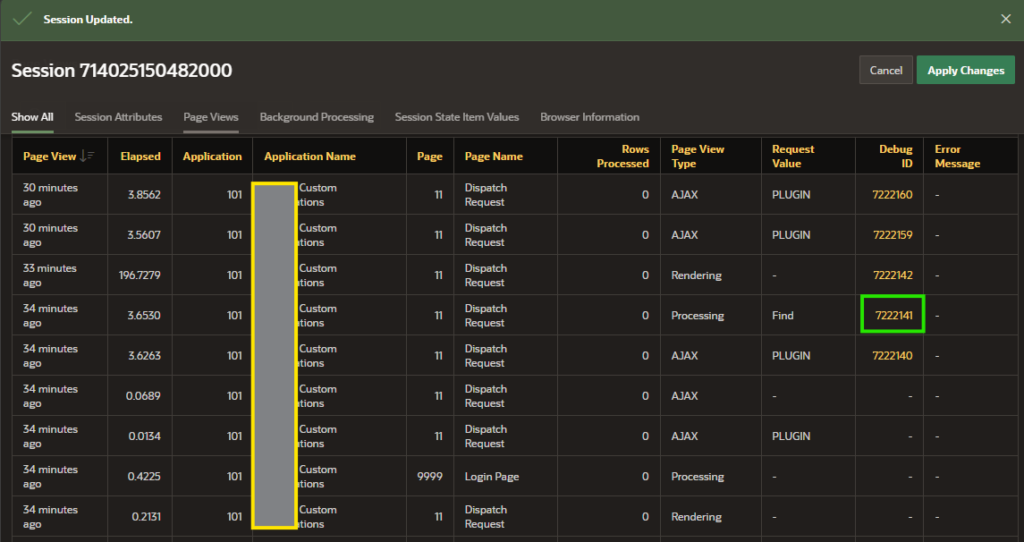
Scroll down to view the session activities for this session below.
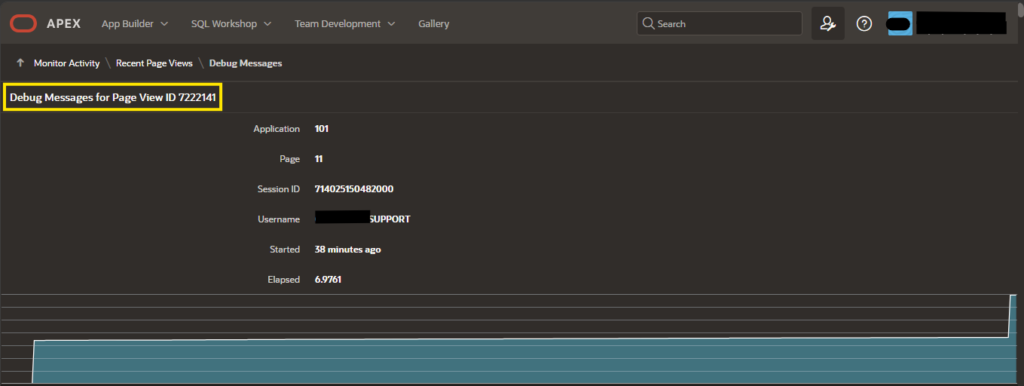
Select and Click on the Debug ID for the request on page that was identified.
Scroll down to view the collected information for that debug id.
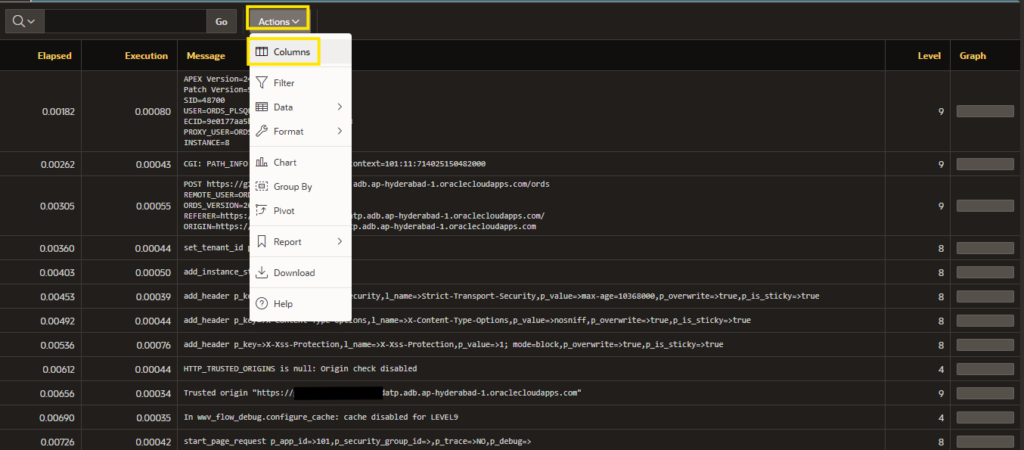
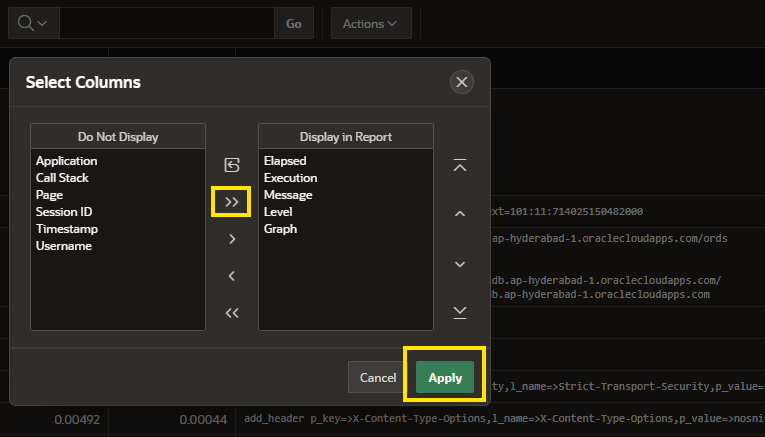
Go to Actions > Columns and add other available columns to Display in Report
Click Apply.
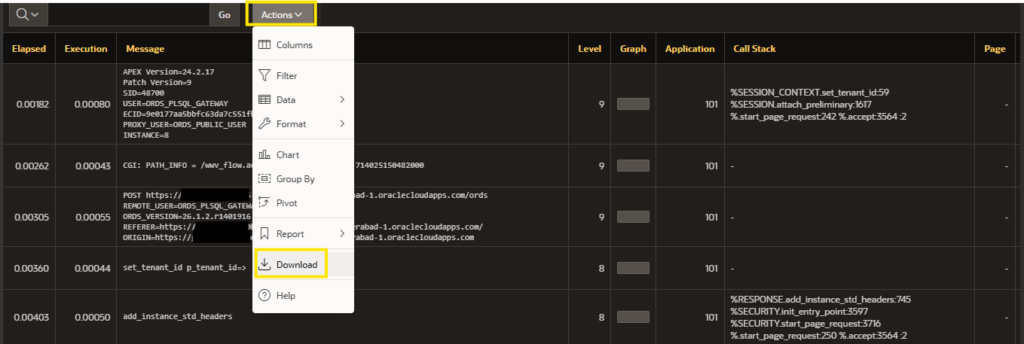
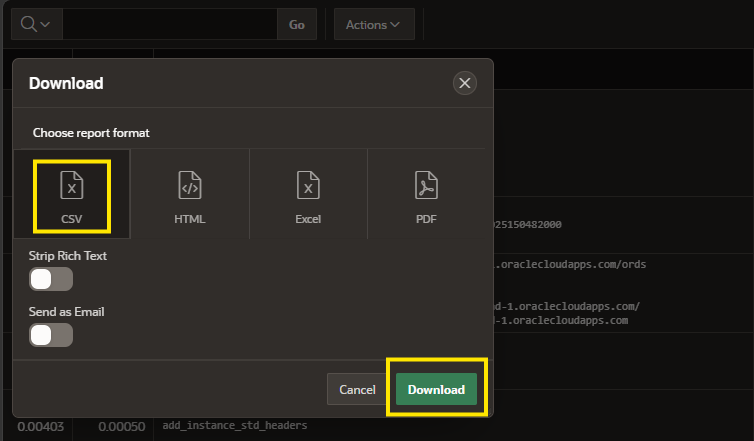
Navigate to Actions -> Download to download the report in available formats.
Download the report and provide it to developer/oracle support for evaluation.
End of Post
Thanks for taking the time to read this post.
Stay tuned for the next post coming soon. . .